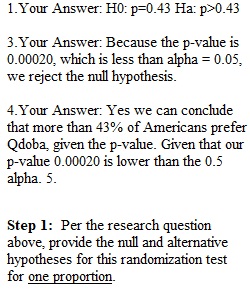
Q Question Set 1. Qdoba vs Chipotle In this question set, you will use StatKey to conduct two different randomization tests. These data are not built into StatKey, so you will need to “Edit Data” to enter them manually. For each part of this question set, use the following research question: Do more than 43% of all American citizens choose Qdoba over Chipotle? We can use a randomization distribution to determine how likely our sample statistic is given that the null hypothesis is true. This probability is known as the p-value. Question Set 1_A: In a random sample of 230 American citizens, 125 people said they prefer Qdoba over Chipotle. Using the five steps from the online notes, conduct a randomization test to address the research question above. Question 1 6 / 6 pts Question Set 1_A: Step 1: Per the research question above, provide the null and alternative hypotheses for this randomization test for one proportion. Hint: Hypotheses are written using population parameters (e.g., p, ?, etc.). For examples, see https://newonlinecourses.science.psu.edu/stat200/lesson/5/5.2/5.2.1 Links to an external site.): H0: (Hint: The sign for H0 is always =) Ha: (Hint: The sign for Ha is <, >, or ?) Question 2 8 / 8 pts Question Set 1_A: Step 2: Construct a randomization distribution under the assumption that the null hypothesis is true. Take at least 5000 resamples. Given that 125 people said they like Qdoba over Chipotle in a random sample of 230 American citizens, use StatKey to construct a randomization distribution under the assumption that the null hypothesis is true: • Go to StatKey at http://www.lock5stat.com/StatKey/randomization_1_cat/randomization_1_cat.html • Click Edit Data > count: 125, sample size: 230 > OK • Change the Null hypothesis to p=0.43 • Take 5000 resamples (i.e. click ‘Generate 1000 Samples’ 5 times) • Since the sign for Ha above is >, choose ‘Right Tail.’ • Click the blue value under the x-axis and change it to the sample proportion (i.e. 125/230 = 0.543). Upload an image of your StatKey results (that I can clearly read). Question 3 12 / 12 pts Question Set 1_A: Steps 3 and 4: The shaded red region in StatKey is your p-value. Use the p-value to decide if you should reject or fail to reject the null hypothesis by filling in the following blanks: Because the p-value is ______ (use 3 decimal places), which is ___________ (less or greater) than alpha = 0.05, we _______________ (reject or fail to reject) the null hypothesis. Question 4 6 / 6 pts Question Set 1_A: Step 5: State a real-world conclusion concerning the original research question. Specifically, can we conclude that more than 43% of all American citizens like Qdoba over Chipotle? Per your p-value above, answer “yes” or “no” and briefly explain your answer. Question Set 1_B: In a random sample of 2300 American Citizens, 1250 people said they prefer Qdoba over Chipotle. Using the five steps from the online notes, conduct a randomization test to address the research question above. Be sure to include your relevant StatKey output. Question 5 8 / 8 pts Question Set 1_B: Step 2: Use StatKey to construct a randomization distribution under the assumption that the null hypothesis is true. (Use the same steps provided above, but use a count=1250 and sample size=2300). Upload an image of your StatKey results (that I can clearly read).
View Related Questions